Display Simulation Results
Once all of the model components have been created and configured (as shown in Data Centre Scenario Specification and Modification), the simulation experiment run has finished (as shown in Run a Simulation). This section explains how to access and read the experiment results post completion of a simulation run.
Show resource utilisation for Compute Node
The Simulation results can be accessed, viewed and exported upon completion of a simulation run. From the Eclipse top menu, Window -> Open Perspective -> Other -> PCM Results must be selected. The data store will be represented in the experiments tree view on the left hand side (Figure 1) arranged according to the execution time stamp and the name given in the previous step of simulation parameters setup.
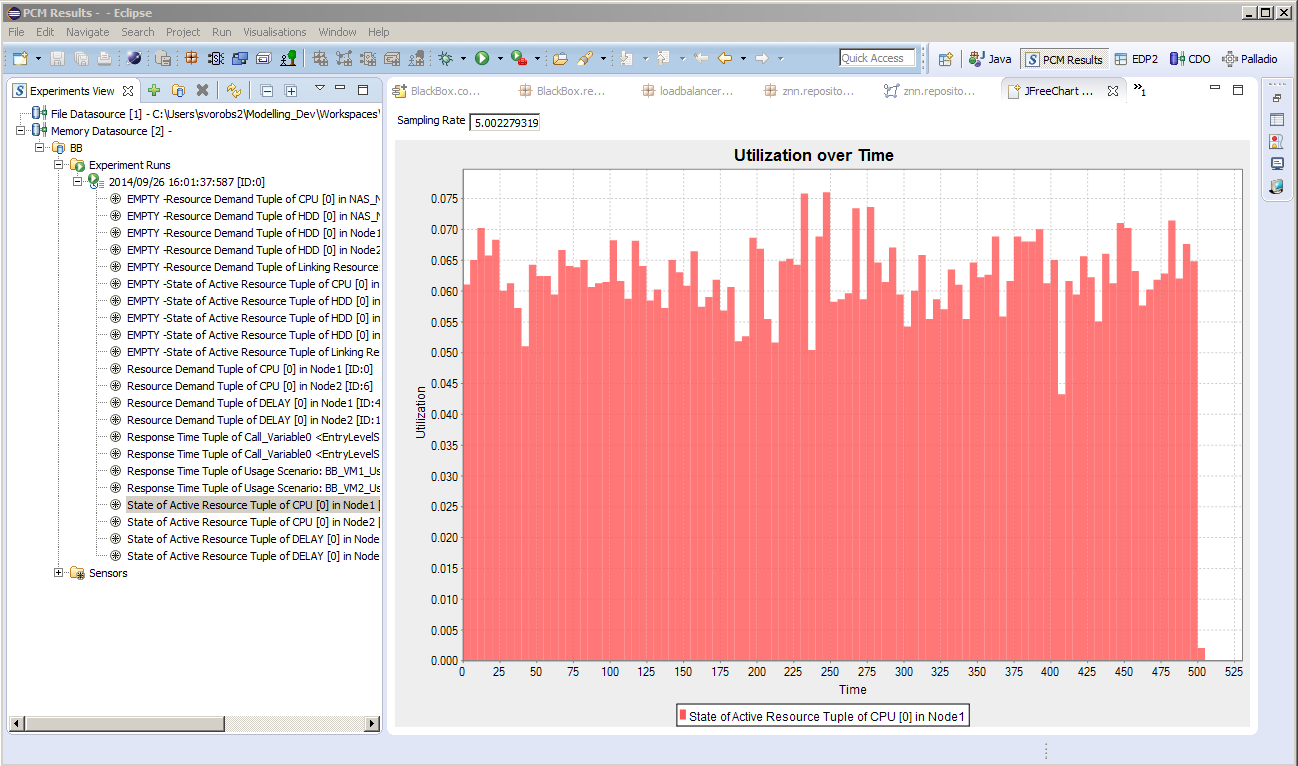 Figure 1: Show Resource Utilization for Compute Node
Double-clicking on the resource tuple will bring up the option menu, as shown in Figure 2. Here the visualisation type for displaying simulated results can be selected.
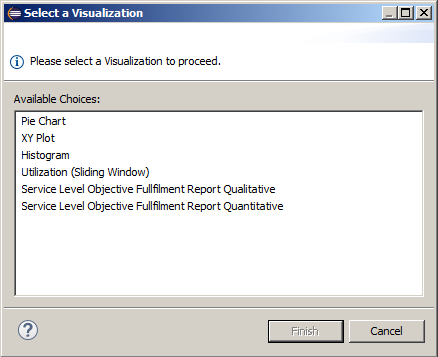
Figure 2: Visualisation selection
Right-clicking will allow the user to access a chart export menu which allows for the moving of results for analysis elsewhere, as shown in Figure 3.
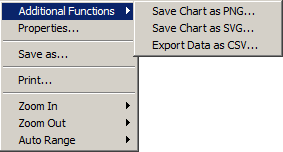
Figure 3: Chart export menu
To view CPU utilisation results, select the entry named State of Active Resource Tuple of CPU [x] on Node x.
Note that if the resource tuple has word “EMPTY” in front of it, it means that no data was collected during the simulation.
Show resource utilisation for local storage of Compute Nodes
The procedure for accessing the local Storage simulated utilisation results is the same as one for Processing Unit shown in Show resource utilization for Compute Node, only to view HDD utilisation results select entry named State of Active Resource Tuple of HDD [x] on Node x. This will display utilization over time results Figure 1 only for the local disk.
Also another type of resource utilisation representation is available in the form of a frequency histogram, as shown in Figure 4.
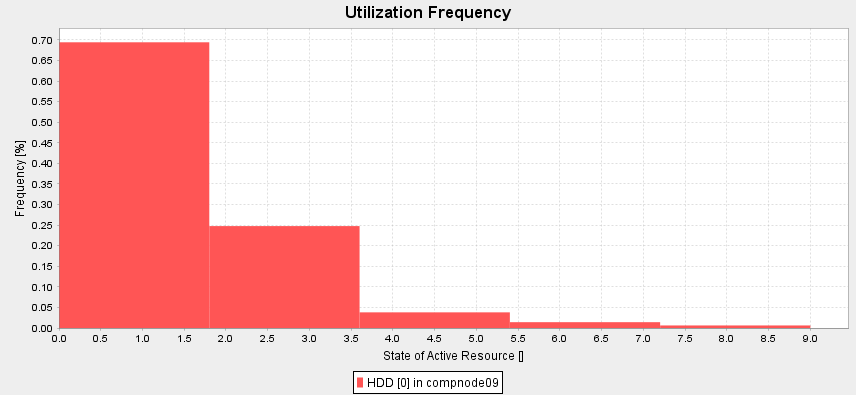 Figure 4: Show resource utilization for local storage of compute nodes
Show energy consumption for Compute Node
The capabilities of CactoSim to handle energy efficiency analysis are based on the scientific publications [18][19] that were the foundation for Palladio extension for energy efficiency analyses.
Once the simulation run is finished, the *.infrastructure file that has been created should be opened. This is the model layer where power distribution units are linked to each node.
- Open EDP2 perspective Experiments view, as shown in Figure 5.
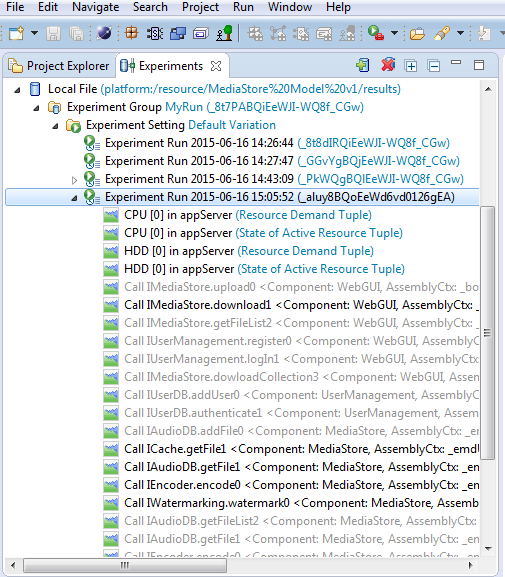
Figure 5: Show energy consumption for compute node - Experiments
- Select the part of the infrastructure for which you want to perform the analysis, shown in Figure 6.
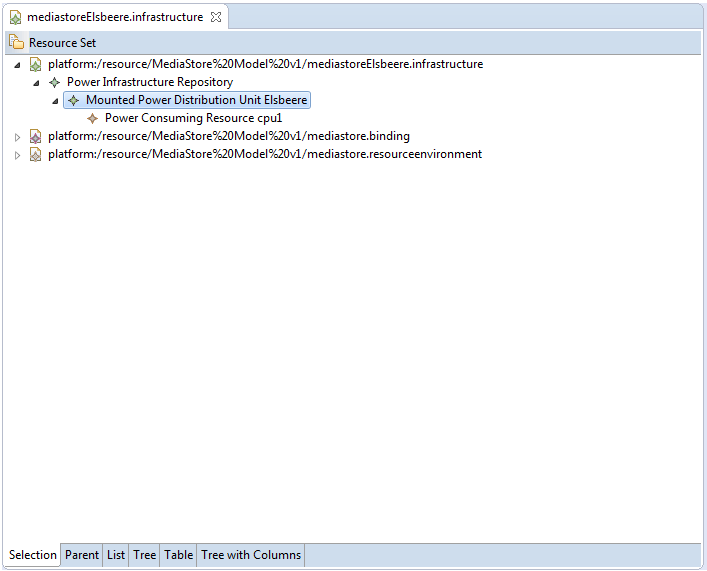 Figure 6: Show energy consumption for compute node –Infrastructure model
- Open the Power Consumption Analysis view, parameterise the analyser, i.e. by setting the sliding window size used to aggregate the CPU utilization.
- Start the consumption analysis by clicking the respective button.
- This will open up graphs for the cumulative energy consumption, shown in Figure 7.
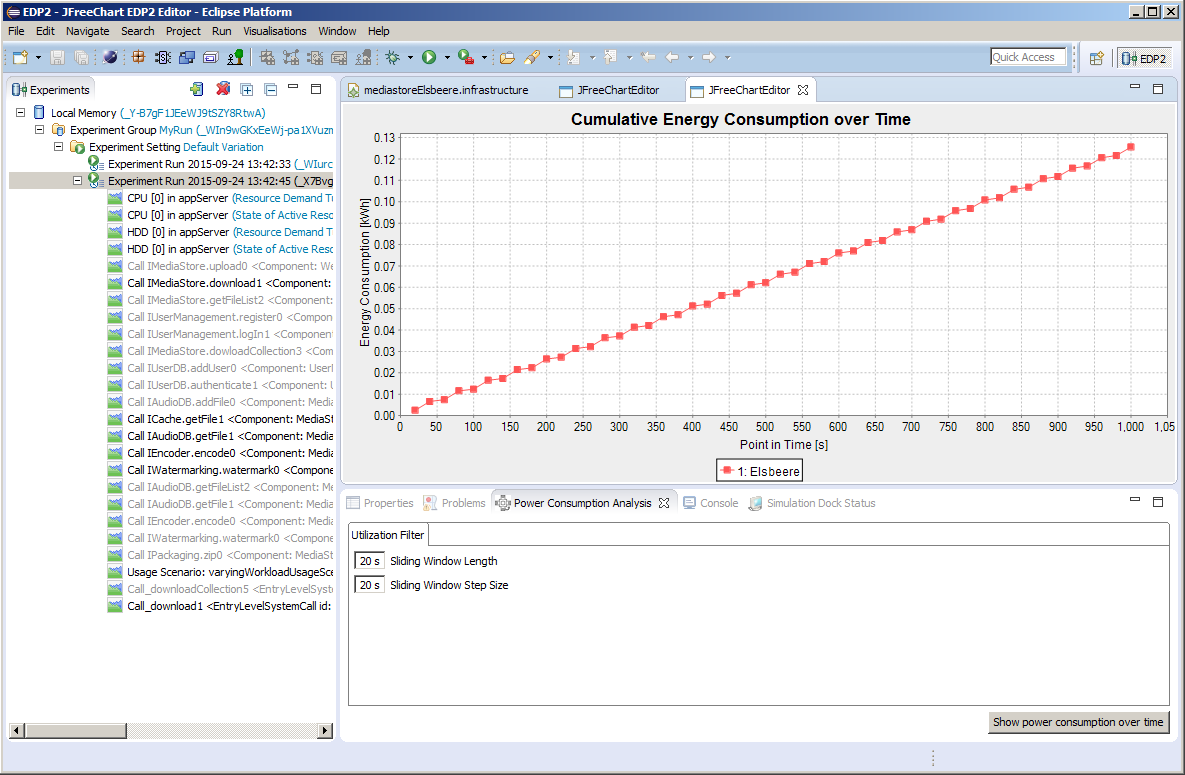 Figure 7: Show energy consumption for compute node –Energy Consumption
- As well as the power consumption, shown in Figure 8.
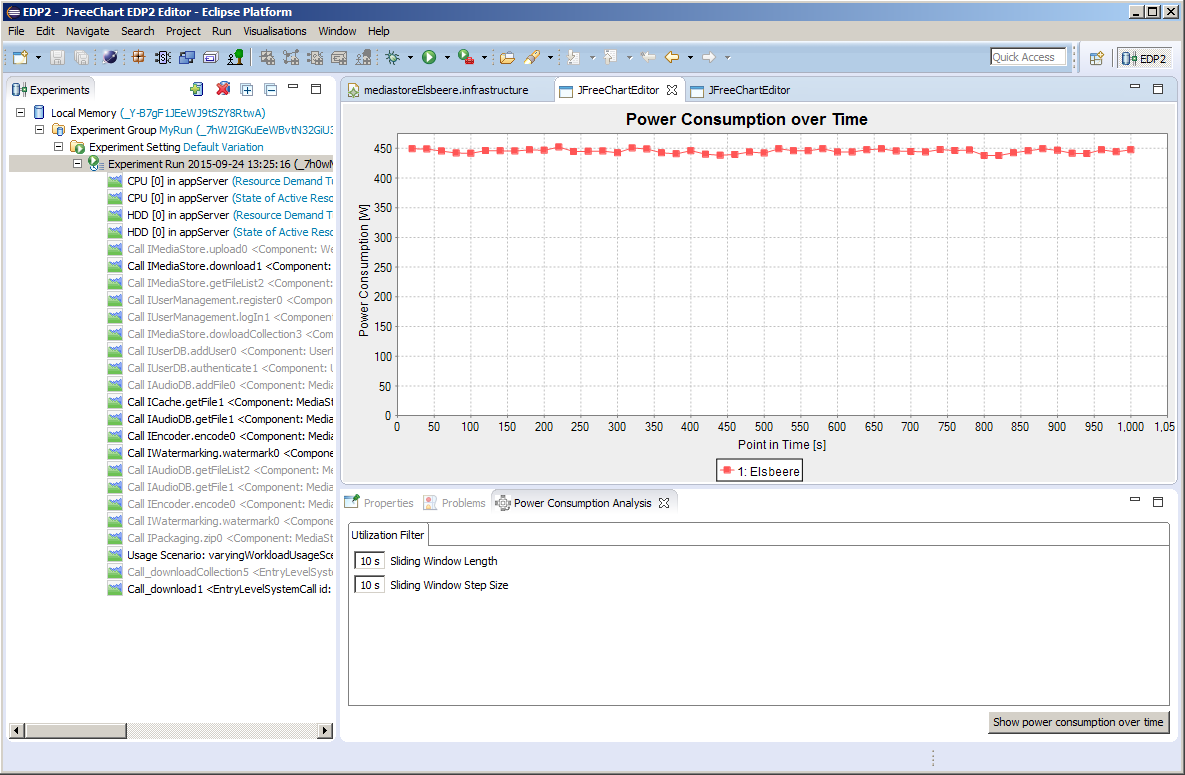 Figure 8: Show power consumption for compute node
Note that Figure 7 and Figure 8 show full screenshots of the Eclipse environment. The Power Consumption Analysis view can be found under Window - > Show view -> Power Consumption.