Monitoring only
CACTOS may be used from a datacentre operator to monitor its infrastructure. By installing and enabling CactoScale in the infrastructure (cf. Figure 1), integrates multiple sources of performance and error monitoring data into a consolidated architecture with a unified interface and storage architecture. Specifically, data agents co-located with the data centre servers collect log traces from user-defined data sources and optionally process this data in place, or forward this data for processing on dedicated CactoScale servers. The CactoScale interface enables both in-situ and off-loaded data processing, with most of the simple filtering operations being feasible in-situ, and only more advanced data correlation algorithms off-loaded to high-throughput processing servers.
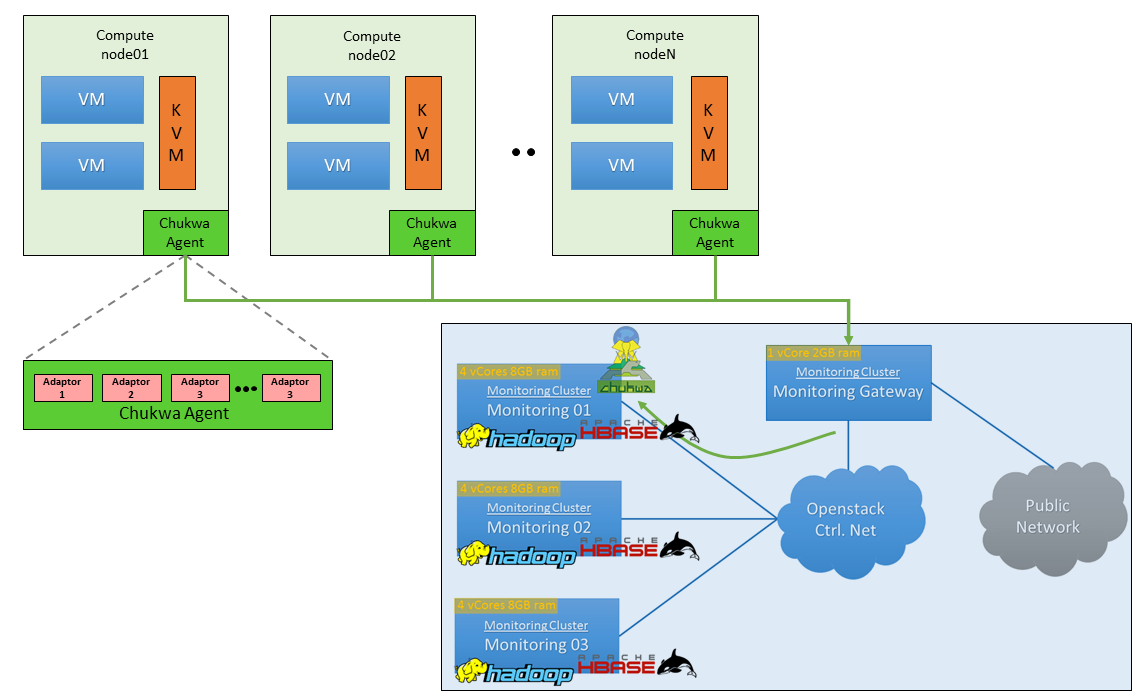
Figure 1: Complete monitoring system in an OpenStack Physical Testbed
Additionally, a monitoring dashboard (cf. Figure 2) has been developed for the user to get meaningful graphs during real time, but also navigate through past historical data.
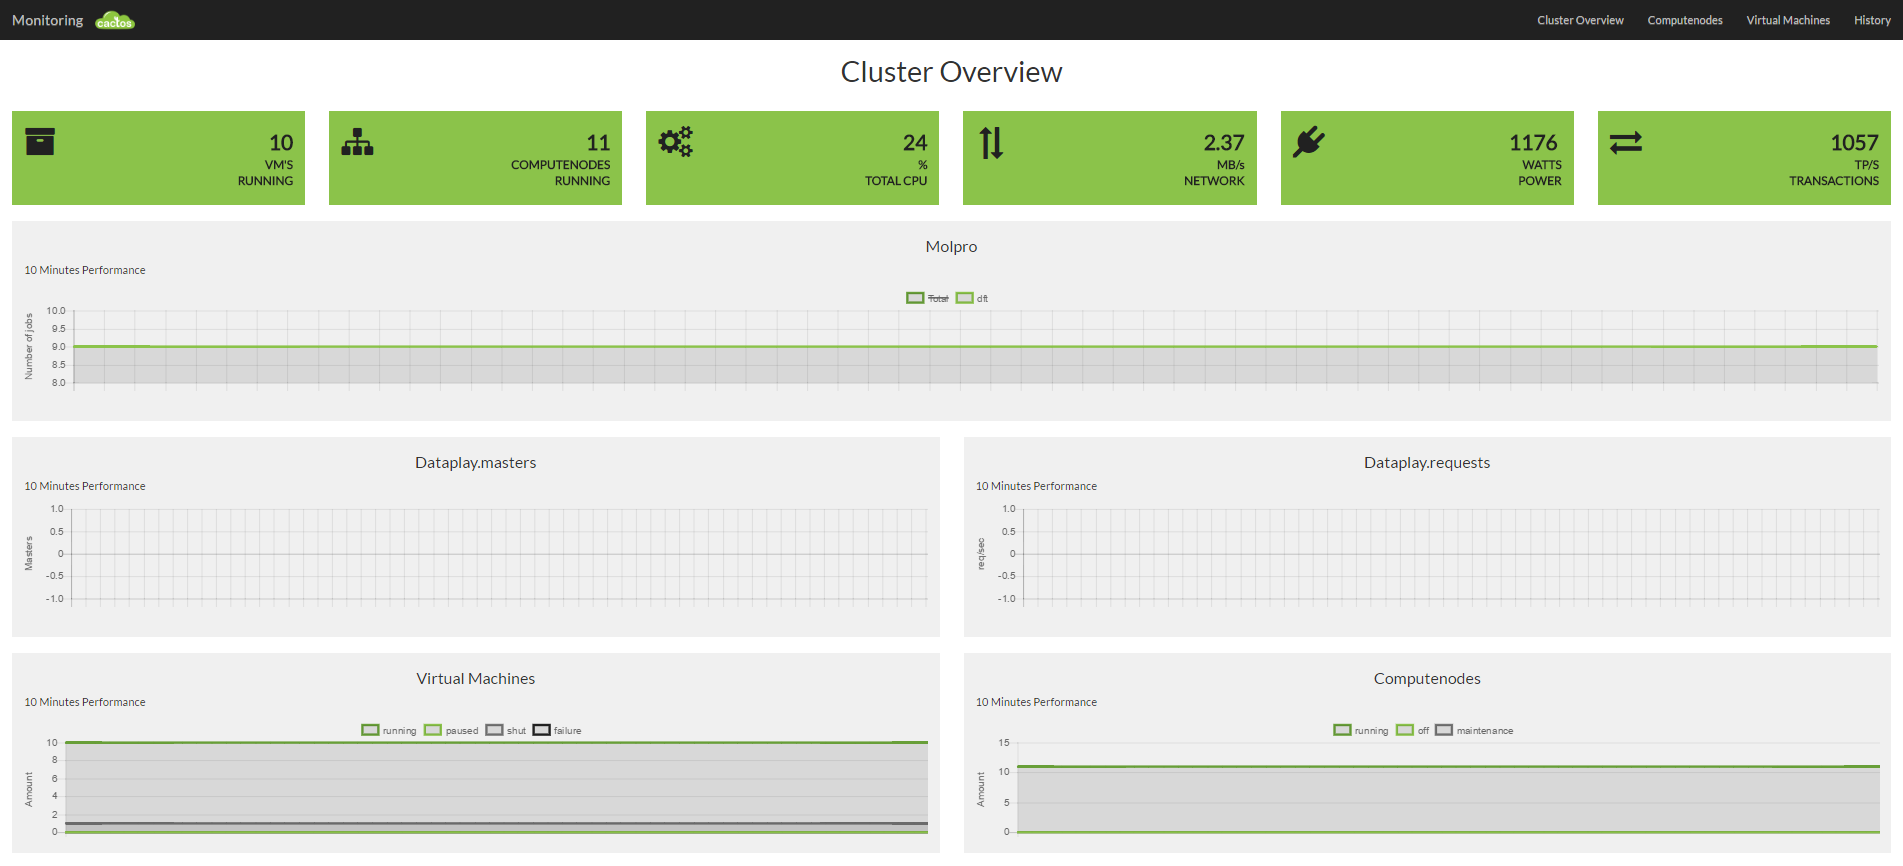
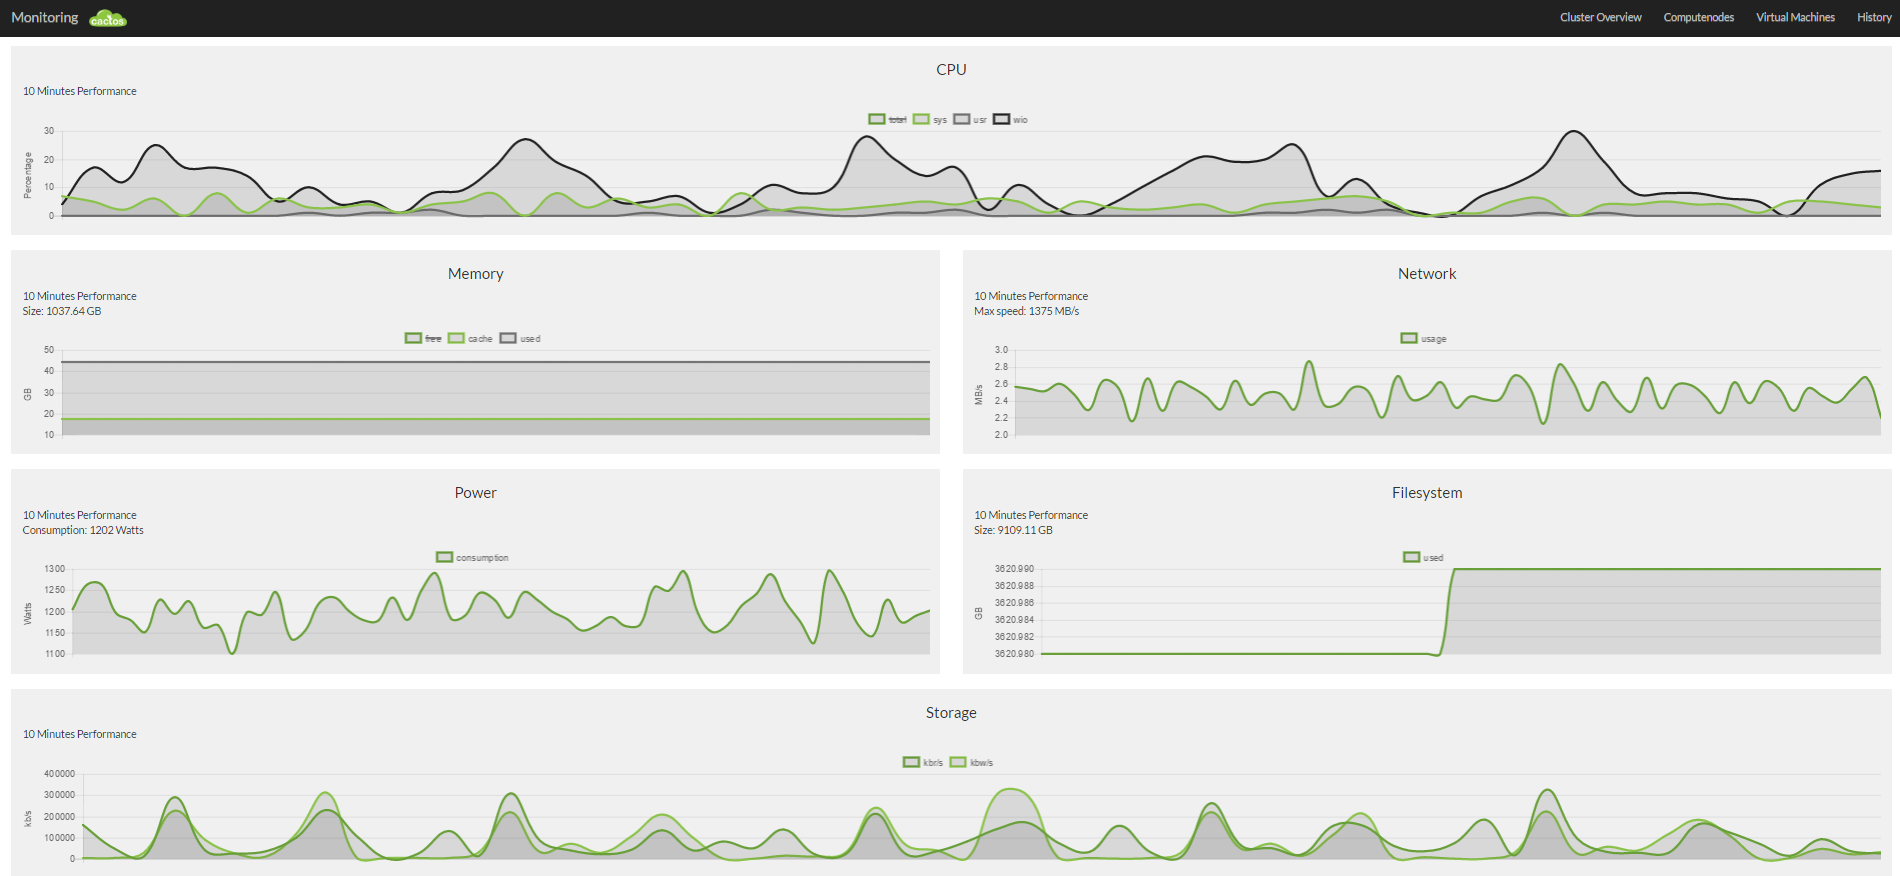
Figure 2: Snapshots of the Monitoring Dashboard